Shallow is the real size of the object in the heap, meanwhile Retained is the complete memory space used by all the references.
https://help.eclipse.org/mars/index.jsp?topic=%2Forg.eclipse.mat.ui.help%2Fconcepts%2Fshallowretainedheap.html
https://plumbr.io/blog/memory-leaks/how-much-memory-what-is-retained-heap
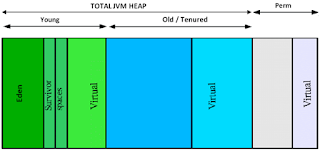
2. Heap diagram:
Many times, it is not very known the states of objects in Heap memory:
https://mechanical-sympathy.blogspot.com/2013/07/java-garbage-collection-distilled.html
3. “GC root path”.
Mat can calculate the full path from GC to any class, this way we can see big size objects.
Now, MAT will start calculating the memory graph to show the paths to the GC root where this instance is referenced. This will show up with another page, showing the references as below:
https://dzone.com/articles/java-out-of-memory-heap-analysis
4. MAT resources
A small good tip is about the necessary resources to run mat.
As a rough estimate if the number of objects is N and the number of classes C, it might take at least T bytes to parse and build the dominator tree where:
T ≈ N * 28.25 + C * 1000 + P
P is the space used by the DTFJ or HPROF parsers. For a PHD file, the space could be:
P ≈ C * 1000
Memory Analyzer uses additional memory for caching index files, so performance will be better if there is more memory available than the minimum required to parse a dump.from: https://help.eclipse.org/mars/index.jsp?topic=%2Forg.eclipse.mat.ui.help%2Ftasks%2Fconfigure_mat.html
5. command line:
Sometimes a good choice to process several heapdumps is to execute thru command line:
sh ./ParseHeapDump.sh /heapdumps/java_7935_heapdump_4p.hprof org.eclipse.mat.api:suspects org.eclipse.mat.api:overview org.eclipse.mat.api:top_components
It will create the following reports:
- org.eclipse.mat.api:suspects
- org.eclipse.mat.api:overview
- org.eclipse.mat.api:top_components


No comments :
Post a Comment